AI Dashboards
Last updated
AgentLaire AI Dashboards (agentlaire_dashboards) turns a sentence into a live dashboard of your Odoo data. It is a paid module, $199 one-time per Odoo version, and needs AgentLaire AI Agents. See the product page.
How do I create a dashboard from a sentence?
Section titled “How do I create a dashboard from a sentence?”In AgentLaire AI Dashboards, you create a dashboard from AI Dashboards › My dashboards.
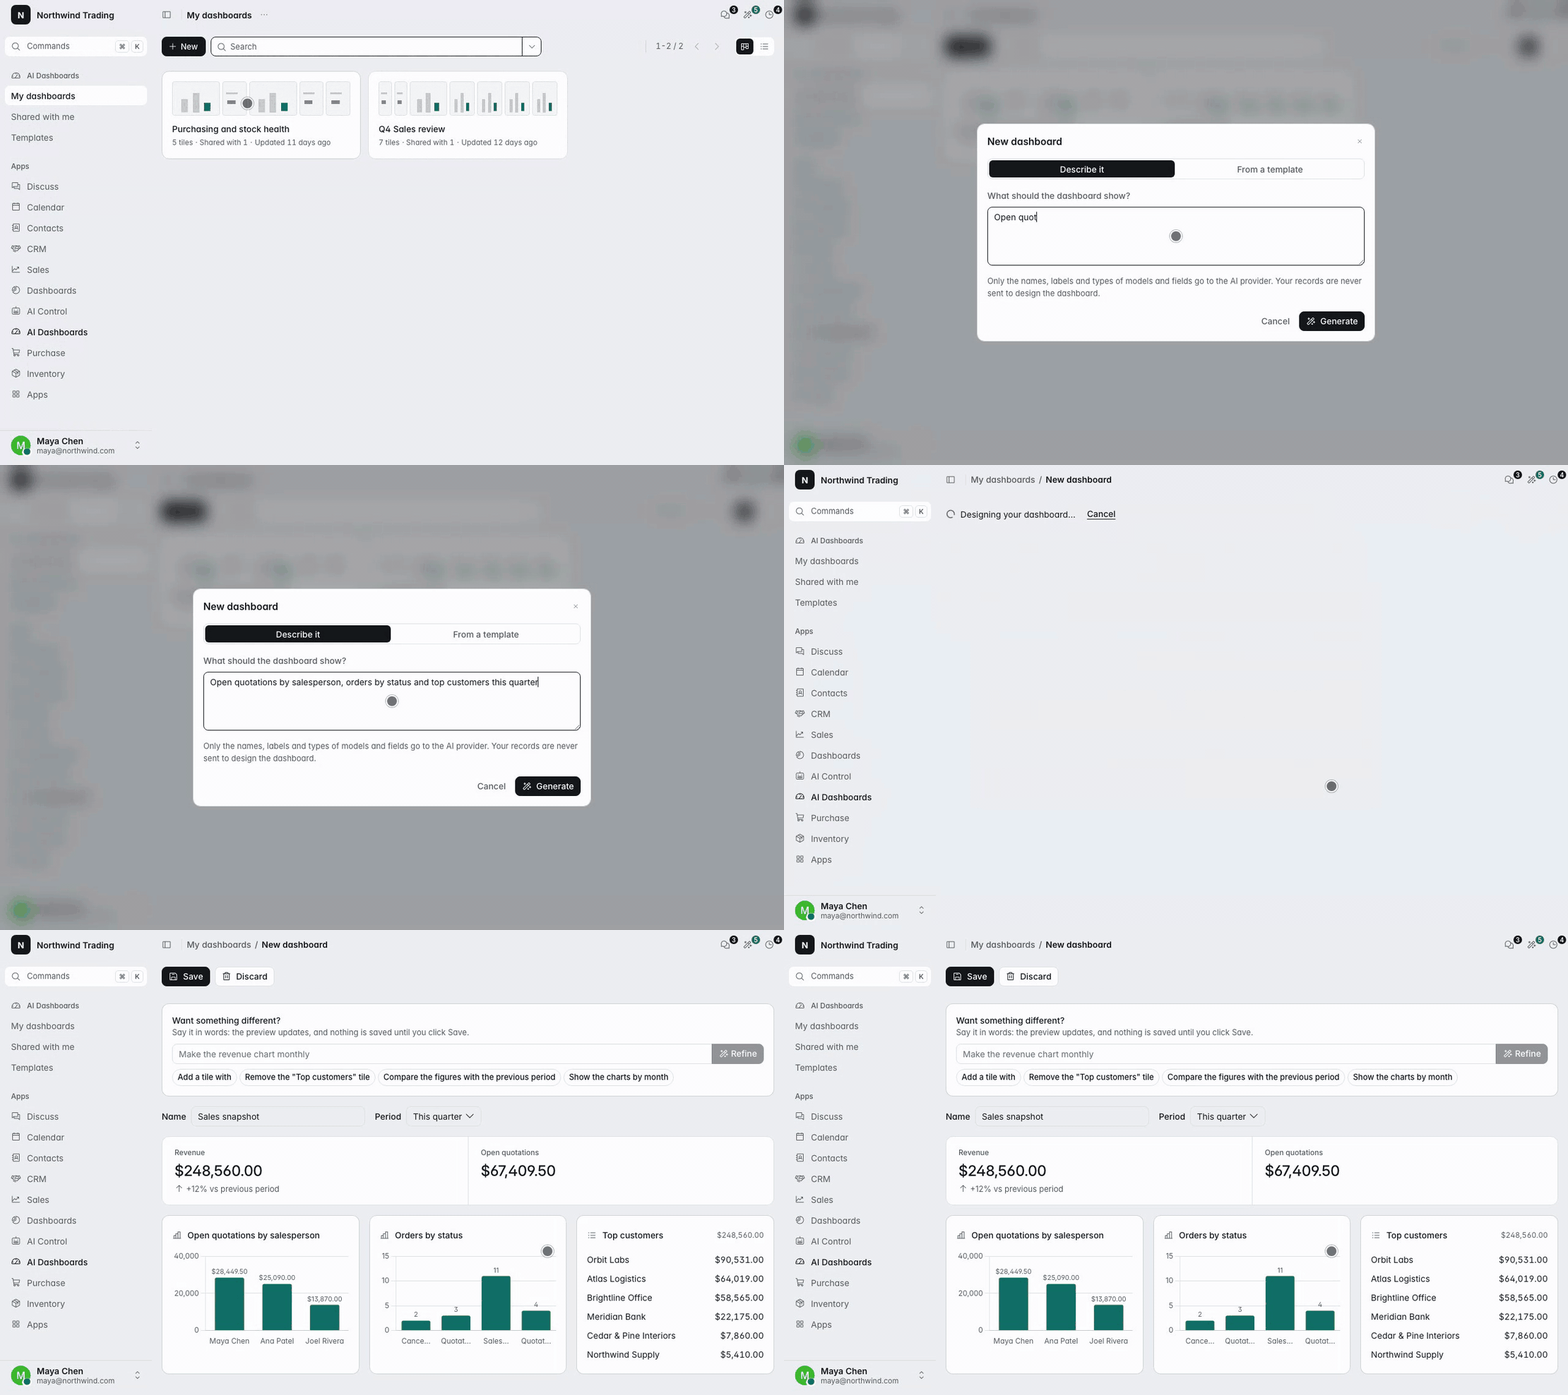
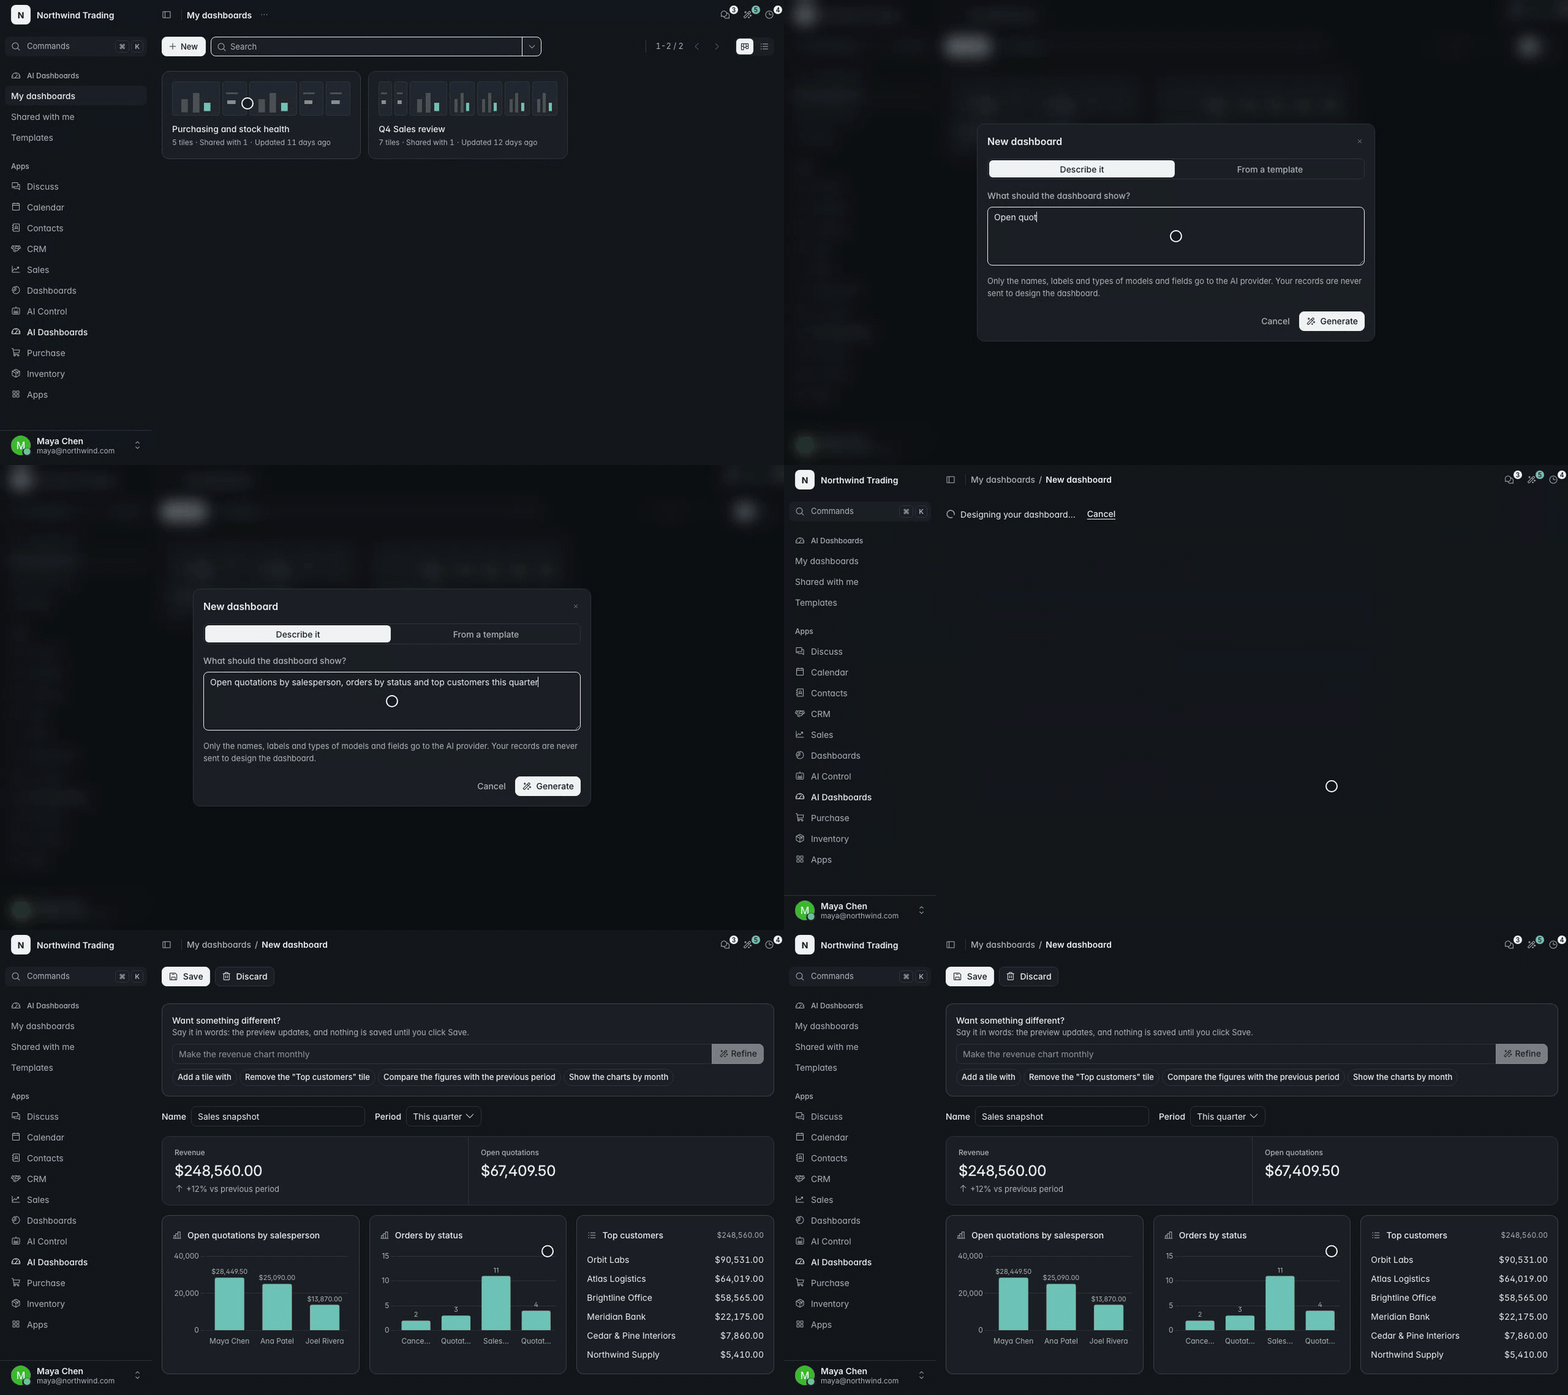
- Click New. The “New dashboard” dialog opens on the Describe it tab.
- Write what the dashboard should show in What should the dashboard show?, for example “Sales by salesperson this quarter vs last, top 10 customers”.
- Click Generate. The built-in agent “AgentLaire AI Dashboard” designs up to 12 tiles.
- Check the preview. It shows live data, computed with your own access rights.
- Change the Name or Period if you want, then click Save. Discard drops it.
Nothing is saved until you click Save, and generating creates no business records.
You can also write “make a dashboard of open quotations by customer” in your agent chat. The agent answers with a link to the preview.
How do I refine a dashboard?
Section titled “How do I refine a dashboard?”AgentLaire AI Dashboards refines a preview with another sentence. Type it in Want something different? and click Refine, for example “make the revenue chart monthly”. The new preview replaces the old one, and the suggestion buttons under the field offer ideas.
To change a saved dashboard, open it and click Edit with prompt. The screen starts from the current tiles, asks What should change?, and Apply previews the change. The changes are listed under “Changes so far”, and the screen shows “Unsaved changes” until you save or discard. Saving keeps the owner and sharing and replaces the tiles.
Two rules apply while you refine:
- The last preview stays on screen while a change is applied, and Save waits until the new preview shows. If a change fails, for example because the monthly AI budget is used up, the last preview stays and the screen says why.
- If the dashboard changed after your edit started, saving is refused. Start the edit again.
Only people who can edit the dashboard see Edit with prompt.
What is a tile?
Section titled “What is a tile?”A tile in AgentLaire AI Dashboards is one figure, chart or list. A dashboard holds up to 12 tiles.
| Property | Values |
|---|---|
| Display | number, bar, line or list |
| Measure | a count, or sum or average of a numeric field |
| Group by | a stored field, with a day, week, month, quarter or year granularity |
| Size | small, medium or large |
| Groups | at most 50 per tile |
The server validates every spec before the preview or the save. Each tile’s model must be readable by you and allowed by an active policy, and every field must be on the policy’s allow-list. A tile that fails is dropped, and the preview says why. No tile runs SQL, and relative dates are resolved on the server.
To edit tiles by hand, click Edit tiles on the dashboard. The form lists each tile’s source model, measure, domain, display and size, and applies the same validation.
Clicking a tile, or Open in its menu, opens the standard Odoo list or graph view with the tile’s domain and grouping.
How do I share a dashboard, and what does each person see?
Section titled “How do I share a dashboard, and what does each person see?”AgentLaire AI Dashboards shares a dashboard with groups, never with data. A new dashboard is private: only the owner and AI Managers can open it.
- Open the dashboard and click Share.
- Pick one or more groups of your company, for example Sales / User.
- Click Save.
Every viewer sees the tiles computed with their own access rights, in one call per refresh. If Bob sees only his own sales orders, his tiles show only his orders, and the dashboard says “Data differs per viewer”. A tile the viewer cannot read shows “Not available to you”. Sharing and saving write a dashboard_saved event to the audit log.
Shared with me lists the dashboards others shared with you, with the owner on each card. Only people who can edit a dashboard see Share.
How do I set the period and refresh?
Section titled “How do I set the period and refresh?”An AgentLaire AI Dashboards dashboard has a period filter for all its tiles: Today, 7 days, 30 days, This month, This quarter or This year. The dashboard’s Default period sets the starting one. It refreshes when you open it, change a filter, click the refresh button, and on its interval.
| Setting | Default | What it does |
|---|---|---|
| Default period | set when saved | The period the dashboard opens on |
| Refresh every | 0 | Seconds between refreshes. 0 refreshes only on demand, otherwise at least 60 |
| Privacy mode | Schema only | What the model receives when you generate (see below) |
These fields are on the dashboard form, opened with Edit tiles.
What does Explain this do?
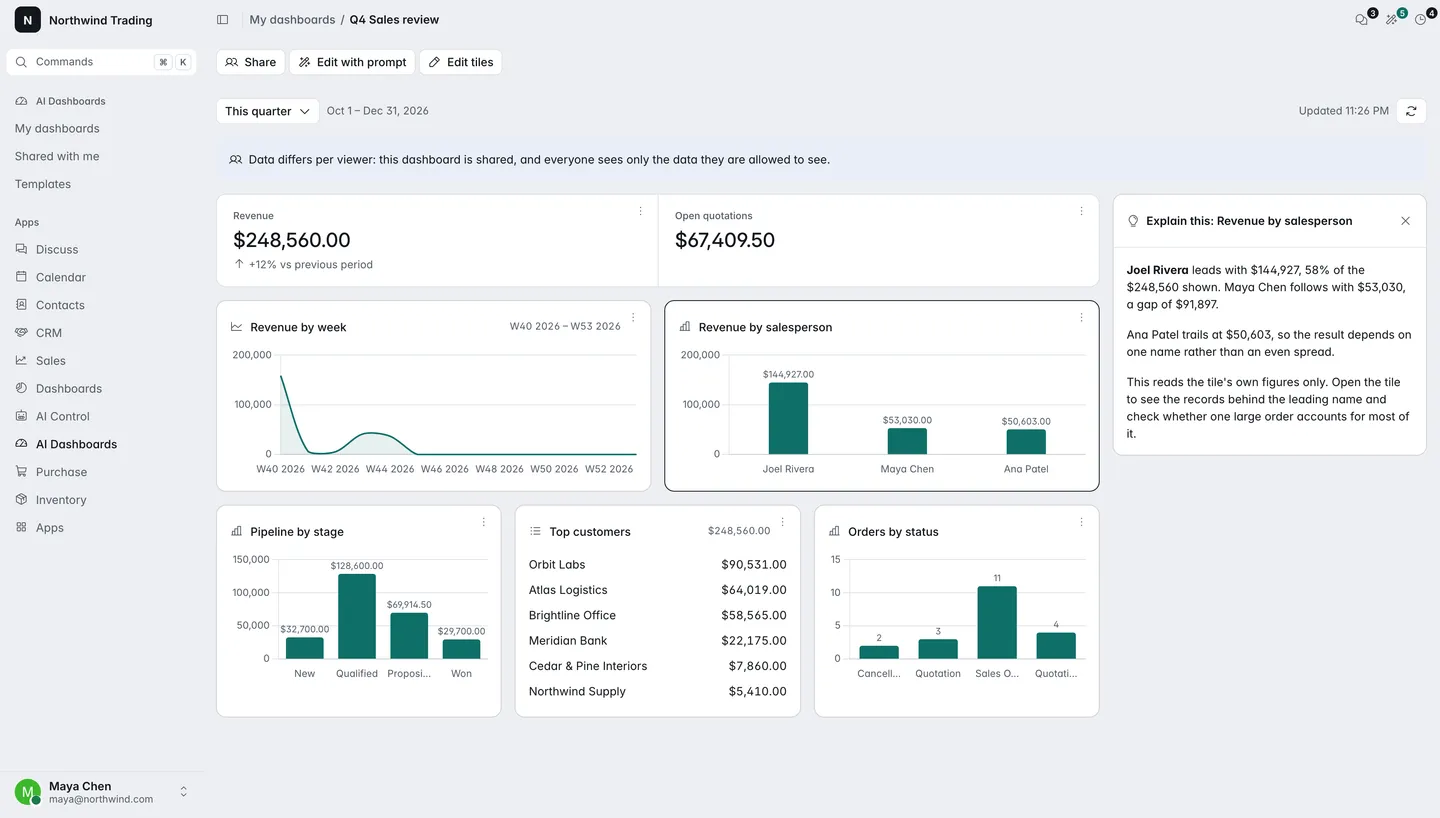
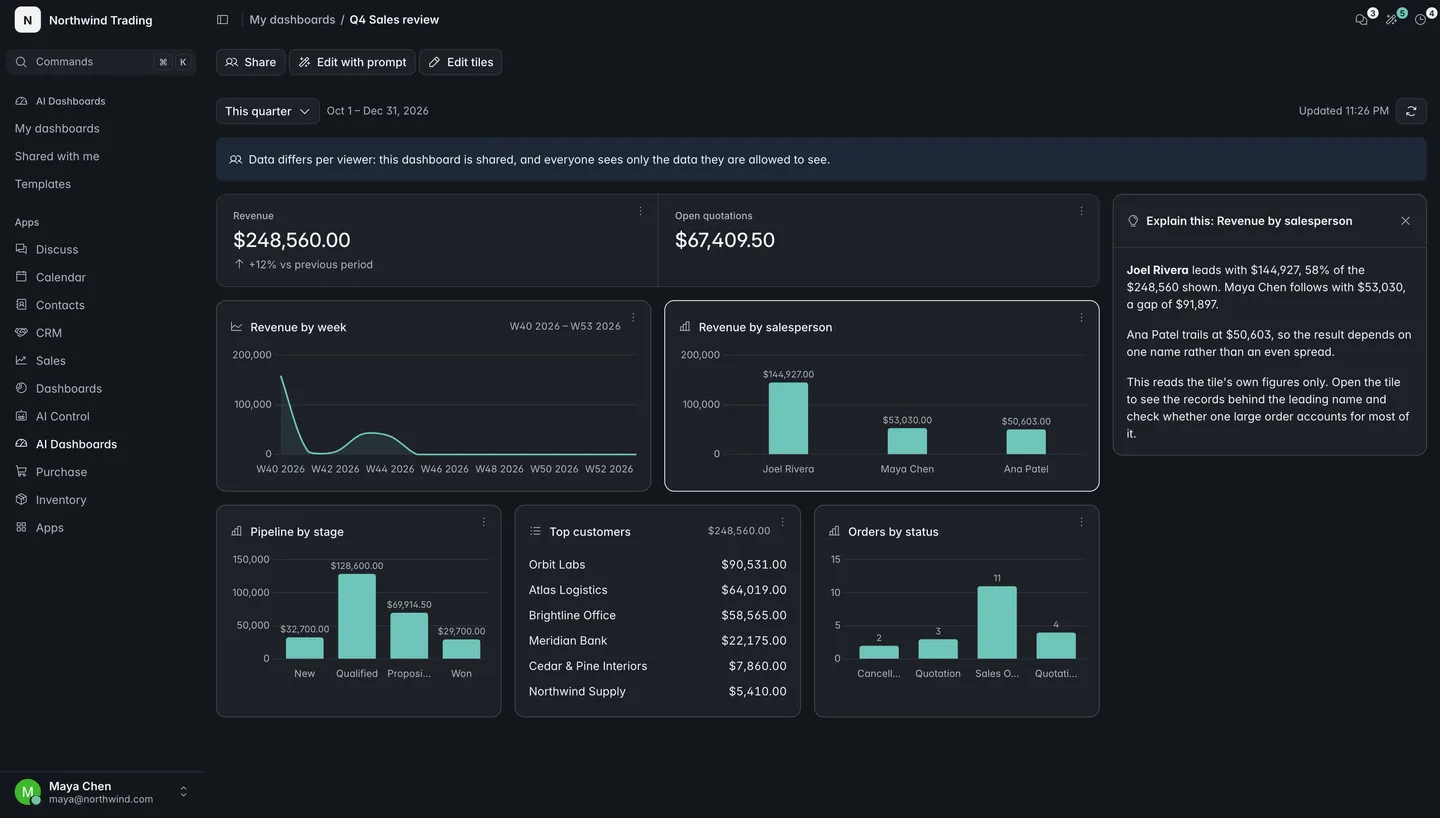
Section titled “What does Explain this do?”AgentLaire AI Dashboards explains a tile with Explain this in the tile’s menu (the three dots). A read-only run receives the tile’s definition and its current and previous results, and may run more grouped reads as you. A side panel shows the answer and the Queries used. It proposes no change.
Explain this sends the tile’s aggregated results to the provider. A manager can turn it off with Allow Explain this, and then the menu entry is hidden. It is on by default. With a local provider nothing leaves the server.
How do I act on a tile?
Section titled “How do I act on a tile?”AgentLaire AI Dashboards hands a tile to your agent with Ask the agent in the tile’s menu. Your agent chat opens with the tile and its filters as context. Any change the agent then proposes goes through a confirm card or the approval queue, as described in Approvals. For example, ask it to draft follow-ups for the customers a tile lists.
What are templates?
Section titled “What are templates?”AgentLaire AI Dashboards lists the templates that installed modules ship under AI Dashboards › Templates. In the New dialog, open From a template and click Use. The dashboard opens, named after the template; a second copy is named “(2)”.
A tile you may not see, such as a purchase tile without purchase rights, is kept and shows “Not available to you” instead of failing. AgentLaire AI Sales & CRM ships “Sales overview” and AgentLaire AI Purchase ships “Purchasing & stock health”. See AI Sales & CRM and AI Purchase.
What is sent to the model?
Section titled “What is sent to the model?”AgentLaire AI Dashboards sends only the names, labels and types of models and fields to the provider by default. This is the Schema only privacy mode (“Names of models and fields only”). No value from a record is sent to design a dashboard.
The designer has metadata tools only. It lists models you can read and a policy allows, describes allowed fields, and checks a draft spec, with at most two correction rounds. It returns a spec, never data.
The second mode, With sample values, also sends up to 20 distinct values of the fields the designer asks about, after redaction. It is chosen per dashboard and is available only after a manager turns on Allow sample values. It is off by default, and until then the choice What is sent to the provider does not appear in the New dialog.
Explain this is separate: it sends the tile’s aggregated results, and a manager can turn it off. The provider, budgets and redaction rules are those of AI Control.
What are the settings?
Section titled “What are the settings?”A manager sets these in AI Control › Configuration › Settings, in the AI Dashboards block. They apply per company.
| Setting | Default | What it does |
|---|---|---|
| Allow sample values | Off | Lets people generate a dashboard in the mode that also sends up to 20 distinct values per field, after redaction |
| Allow Explain this | On | Lets people send a tile’s aggregated results to the provider. When off, Explain this is hidden |